TL;DR: I tested how good Claude Sonnet 5.5 is on a realistic piece of sales work. It got a messy CRM export with 61 deals and nine kinds of error I'd planted on purpose, and had to deliver a Q4 forecast in Excel and five slides for the board. Then Opus 5.5 got exactly the same job. Both hit the forecast to the krone, DKK 6,529,724, and both caught all nine error types. On my clock Sonnet finished in 2 minutes 3 seconds, Opus in 3 minutes 16, and at API list prices the runs cost $0.58 against $1.39. Opus built the better deck. My takeaway: Sonnet for the analysis you run every week. Opus for what the board sees.
Claude Sonnet 5.5 came out on 28 September. I've written about what the switch to Sonnet 5.5 means for your agents. But what I wanted to know was something else: how good is it at the work a sales team actually does?
So at two in the morning I put it to work as a RevOps analyst. Then I gave exactly the same job to Opus 5.5, Anthropic's pricier model for harder work. Same prompt and same file, sent in two Claude app windows at the same moment. The film above shows the two runs side by side, rebuilt from the run logs and the real files and sped up. The clock is real time.

The job: a messy CRM export and a board meeting
The company is called Havblik Software ApS. It doesn't exist. Neither does the pipeline, but it looks like one I've seen many times: 61 deals exported from a CRM on a Tuesday morning because the CFO needs a number for the board.
The model had to do three things. Clean the data without silently dropping anything. Build a weighted Q4 2026 revenue forecast in Danish kroner with fixed probabilities per stage, from 10 percent for Qualified to 70 percent for Negotiation, and euros converted at 7.46. And deliver three files: an Excel workbook with live formulas, five slides a CFO can present as is, and a list of every data problem.
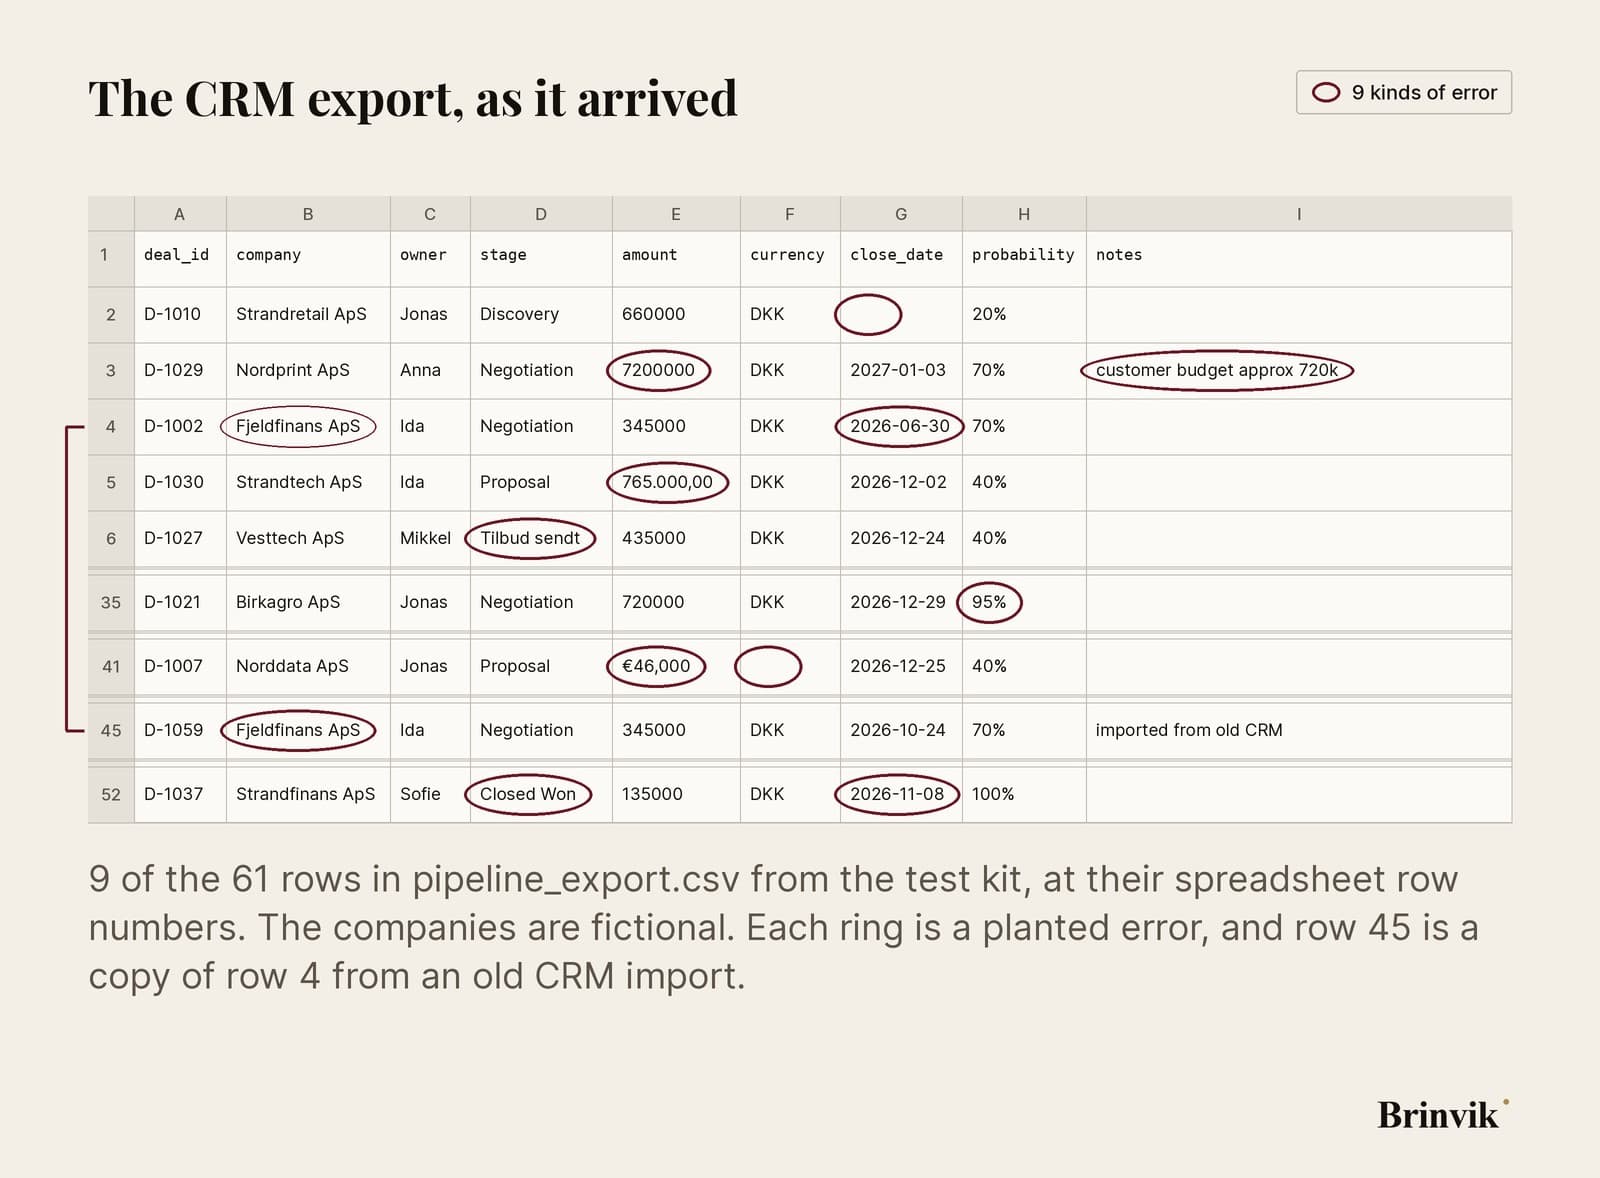
There were nine kinds. Three deals appeared twice after an old import. Four amounts were in euros, and on two of them the currency was only a € sign. Stage names came in five non-standard spellings, two of them Danish. Five open deals had a close date that had already passed, and four had none. Three probabilities contradicted the stage. Four amounts were stored as text in Danish number format. One deal had an extra zero. And one was marked won with a close date in November.
Before either model saw the file, I wrote the answer key: DKK 6,529,724 from 27 deals, and every error by deal ID. That way neither of them could talk me round with a nice slide.

Same forecast, to the krone
Both models landed on DKK 6,529,724 from 27 deals. Exactly the answer key. Both caught all nine error types, kept all 61 rows and built the workbook with real formulas that recalculate if you change a probability. Neither of them typed the total in as a number.
They also made the hard calls the same way. The deal at DKK 7.2m with a note saying the budget was about 720k was corrected to 720,000 and flagged for the rep. The duplicates were kept out and the originals kept in. Deals with no close date stayed out of Q4, because you can't put them in a quarter.
Where they differed was in what else they noticed. Opus spotted that two of the duplicates carried Q4 close dates while the originals had dates in the past, and worked out that the forecast rises by DKK 0.30m if sales confirms the new dates. Sonnet put the same 0.30m on its upside slide, and also questioned a deal at 75,000 that might have been 750,000. The 75,000 was actually right. But that's the kind of doubt I'd rather have in writing than buried.

Sonnet 5.5 was faster and half the price per token
Sonnet 5.5 finished in 2 minutes 3 seconds with 9 tool calls. Opus 5.5 took 3 minutes 16 seconds and 15 calls. That's my own measurement from one run each, and timing varies from run to run.

The price doesn't vary. Sonnet 5.5 costs $2 per million input tokens and $10 per million output tokens. Opus 5.5 costs $4 and $20. Half the price per token, for the same number.
At Anthropic's list prices, from the token counts in each run's log, the runs cost $0.58 for Sonnet and $1.39 for Opus. Sonnet's output tokens are an estimate. So Opus cost almost two and a half times as much, because it's pricier per token and it used more of them.
I haven't dug into what Opus spent its six extra calls on. What I can see is what it delivered.

Opus 5.5 built the deck I'd show a board
Opus made five slides that hang together. Three headline numbers up top. A bar chart with a stage table beside it. A slide showing that December carries half the quarter, DKK 3.37m of 6.53m, next to the quarter split by sales rep. A slide on the cleanup with three cards saying what it did to the number. And finally risks, upside and what sales has to fix by 6 October.
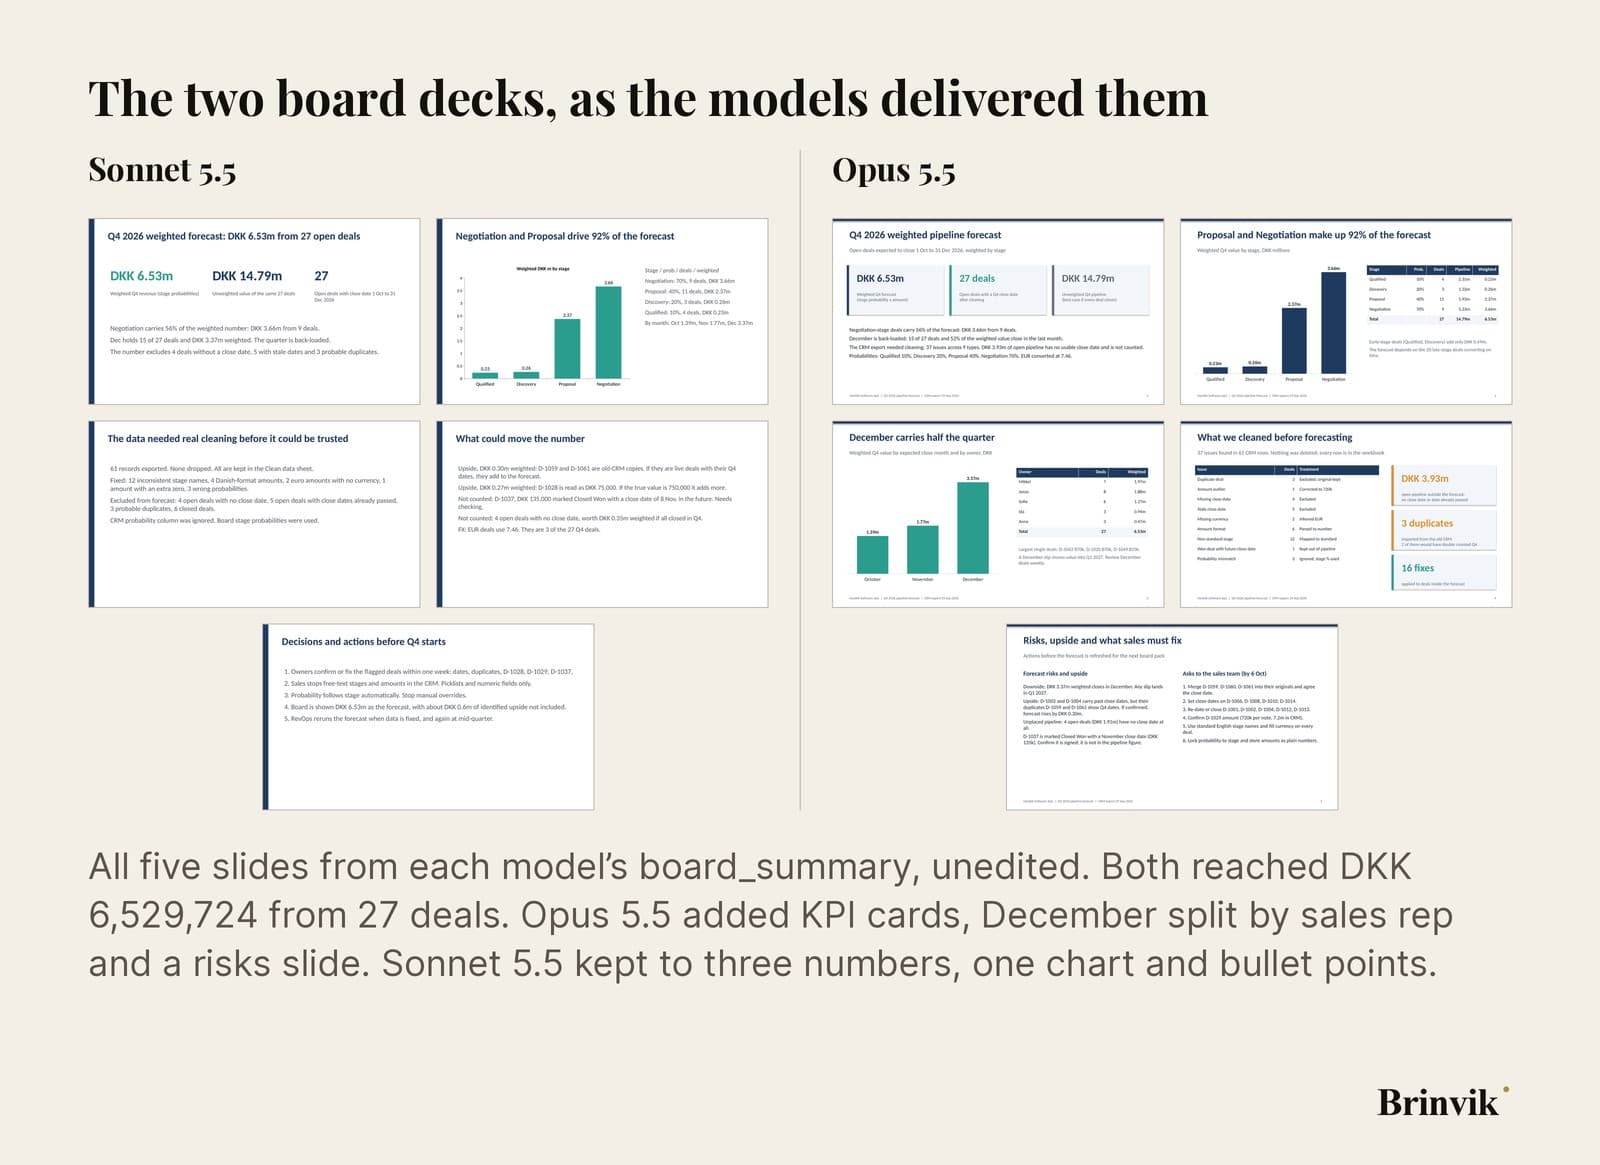
Sonnet's deck was correct. The numbers were there, the conclusions were right, and slide 4 on what could move the number was genuinely sharp. But after the first two slides it was bullet points. A CFO could use it. Nobody would look forward to presenting it.
That matches what Anthropic said at launch: Sonnet 5.5 is strongest at well-scoped everyday tasks, while Opus 5.5 is still clearly stronger at complex, open-ended work that needs judgment over time. A board deck is judgment: deciding what goes in and what the board should worry about.

How I'd split the models in AI for revenue operations
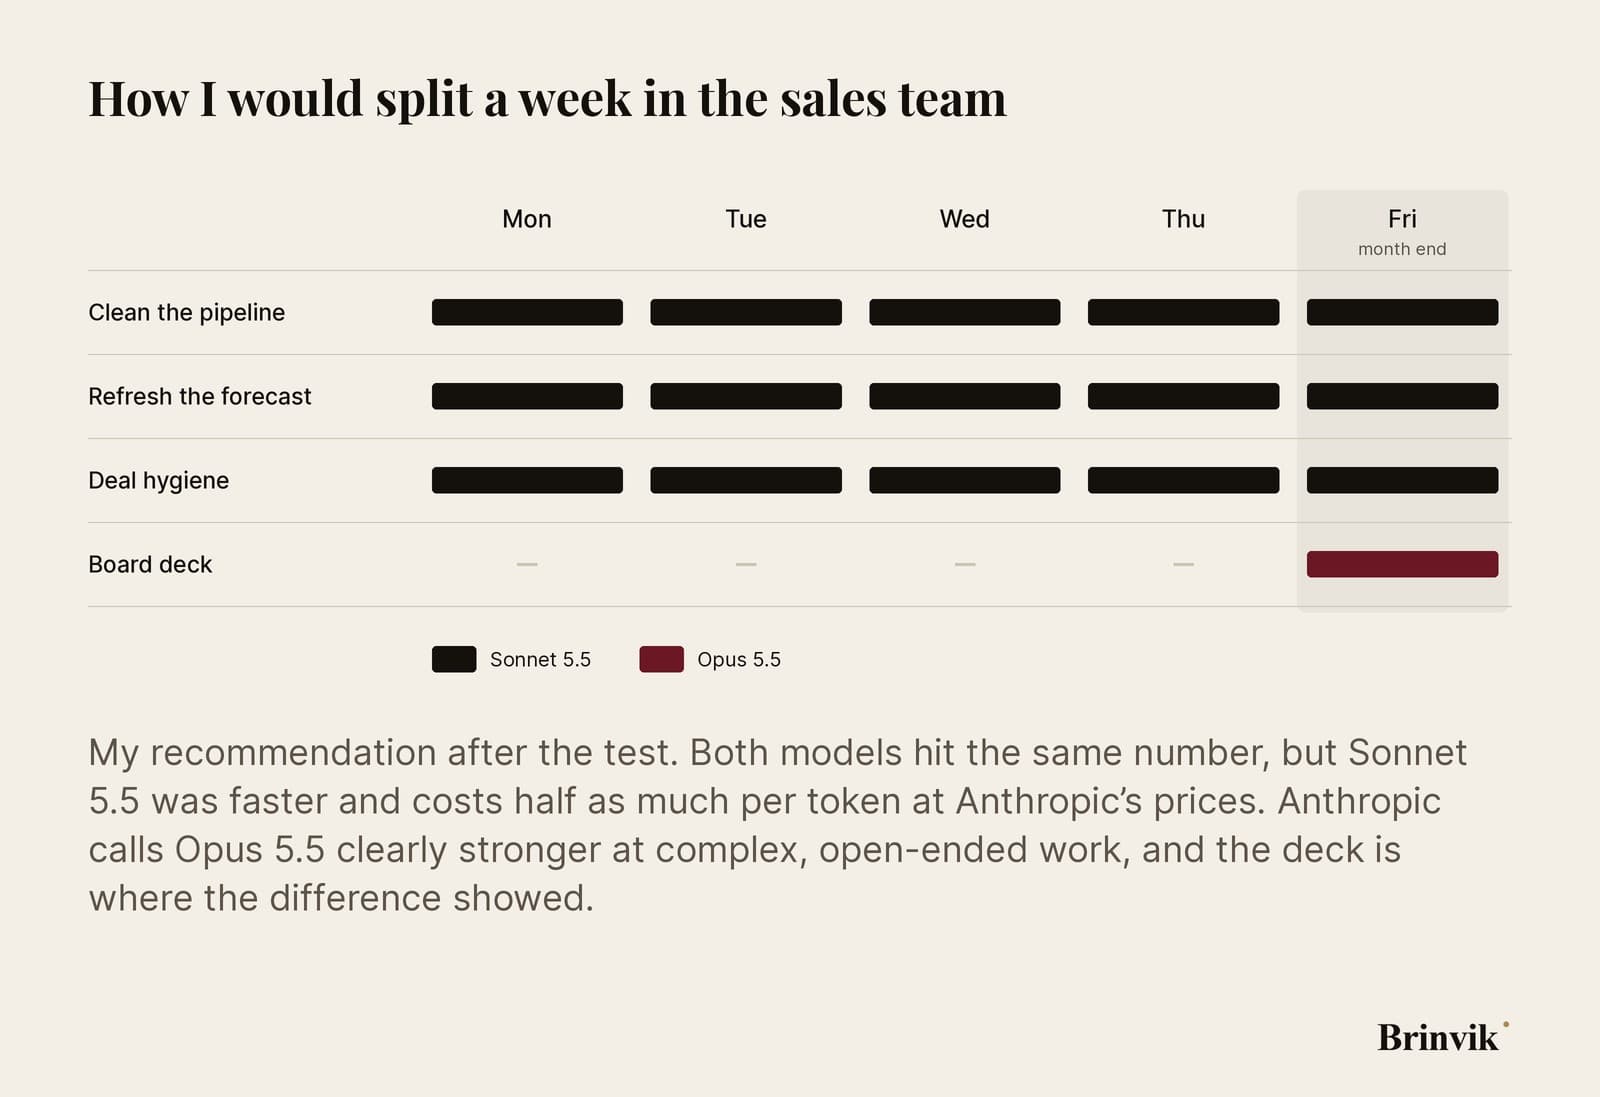
Pick the model per deliverable, not per company. That's where I landed after the test, and it isn't where I started. I expected to find a winner.
Instead I found two different jobs. On the weekly analysis, where the number has to be right and the errors have to be found, Sonnet did as well as Opus, faster and at half the price per token. On the thing that goes in front of a board, Opus did better, and there an extra minute and double the token price don't matter.
That's AI for revenue operations in practice, and it's how you reduce repetitive work with AI: the dull part runs every week on the cheaper model, and you save the expensive one for where judgment counts.
One thing doesn't change whichever model you pick. Both models flagged deals a human has to answer: the amount with an extra zero, the won deal dated in the future, the three duplicates. A model can find the error. It can't ring the rep and ask.

What the test doesn't show, and how to run it yourself
One run per model, on data I made up, against an answer key I wrote. That makes it a first look. I timed it myself, and another run could give another number. Nothing broke along the way, but Sonnet's doubt about the 75,000 deal was a false alarm, and in a real pipeline a false alarm costs a rep's time.
So you can take the whole test and run it yourself. Download the test kit here. It has the prompt both models got, the CSV with the 61 deals, the answer key and both models' files exactly as delivered. Swap in your own export, anonymised, and write your own answer key before you look at the result.
In my piece on Opus 5.5 I argued that the only measurement that counts is the one you run on your own work. This is that measurement, run once. It won't tell you anything about your data until you've run it on your data.

Internal AI tools for sales teams: what I build
As an AI consultant I build this kind of thing for sales teams: an agent that cleans the pipeline and refreshes the forecast every week, and writes the reps a list of what only they can answer. The hard part is usually writing the answer key, so you can tell whether the agent is right before you let it run on its own. That's what I mean by internal AI tools, and it's where Claude for business pays off most in a sales team.
FAQ
Frequently asked questions
In my test, yes. It hit the weighted Q4 forecast exactly, DKK 6,529,724 from 27 deals, and caught all nine planted error types. That's one run on made-up data, so run the test on your own export before you trust it.
Half as much per token. Sonnet 5.5 costs $2 per million input tokens and $10 per million output tokens. Opus 5.5 costs $4 and $20. In my test the tokens used came to $0.58 for Sonnet and $1.39 for Opus at list prices.
When the deliverable needs judgment: what goes in, what gets emphasis, what the reader should worry about. In the test Opus built the better board deck. Anthropic says so too: Opus 5.5 is still clearly stronger at complex, open-ended work.
Yes. The test kit has the prompt, the CSV and the answer key. Use an anonymised export, write your own answer key first, and check your data processing agreement before real customer data goes to an AI model.
Yes, both. The forecast sheet calculates with COUNTIFS and SUMIFS against the clean data sheet, so the number changes if you correct a probability or a deal. Neither typed the total in as a fixed number.
Start with one job you already do every week, such as pipeline cleanup or the forecast. Write an answer key for a week you know the answer to, and let Claude run it. Once the number's right, it can run on a schedule and you spend your time on the deals it flags.
It depends on how many systems the agent has to talk to. I work at a fixed price, and a weekly forecast agent on one CRM is a well-defined job. The prices are on my pricing page.